On the morning of March 11, 2026, approximately 1.3 million Australian school students sat down to take the NAPLAN writing test online. The system crashed. Nationally. Spectacularly.
The next morning, reading the media's reflection over my first coffee of the day, the scale of it started to land. Students locked out. Teachers watching frozen screens. Emergency paper backup tests being scrambled. The whole thing collapsing under a load that, by internet standards, is a rounding error.
My Year 7 Digital Technology class was sitting the test during what is normally our digital tech lesson. They experienced the crash firsthand. Frozen screens. Lost responses. The collective frustration of having the system fail underneath you. Here was a nationwide technology failure, live, in real time, happening to my students, and it was built on a problem that is fundamentally mathematical. How many users tried to connect? How much data was involved? How does that compare to other things the internet handles without blinking?
Someone once said that knowledge is a consequence of experience. I think it was Piaget. Somewhere between the first and second coffee, the question shifted from "how did this happen" to "could this be next week's lesson?"
The Build
I opened Claude in Cowork mode and started typing. No plan. No wireframe. Just a hunch that the NAPLAN crash could be turned into something students would enjoy pulling apart.
What followed was a two-prompt build that produced a fully interactive, data-driven computational report. The whole thing took less time than it takes to write a half-decent email to parents.
Prompt 1: The Idea
"A fun computational exercise. So in the news if you search across Australia yesterday you will find stories about the national testing for students NAPLAN failed and crashed for students yesterday across the country. I want you to do a fun computational exercise that looks at numerous things we do online that could handle a bigger load than 1.3 million school kids trying to do an online test. Make it humorous and insightful, bring out the computation and mathematics. Surely more kids were in line digitally to buy Taylor Swift tickets than were waiting to write a short story for NAPLAN. I want diagrams and images, a really fun report."
That's it. Typos and all. No technology specified. No chart library chosen. No colour scheme discussed.
What made it work was that it communicated intent, tone, and audience clearly. It said what the output should feel like, not what it should be built with. The Taylor Swift reference seeded a direction. The phrase "bring out the computation and mathematics" signalled this should show its working, not just state opinions.
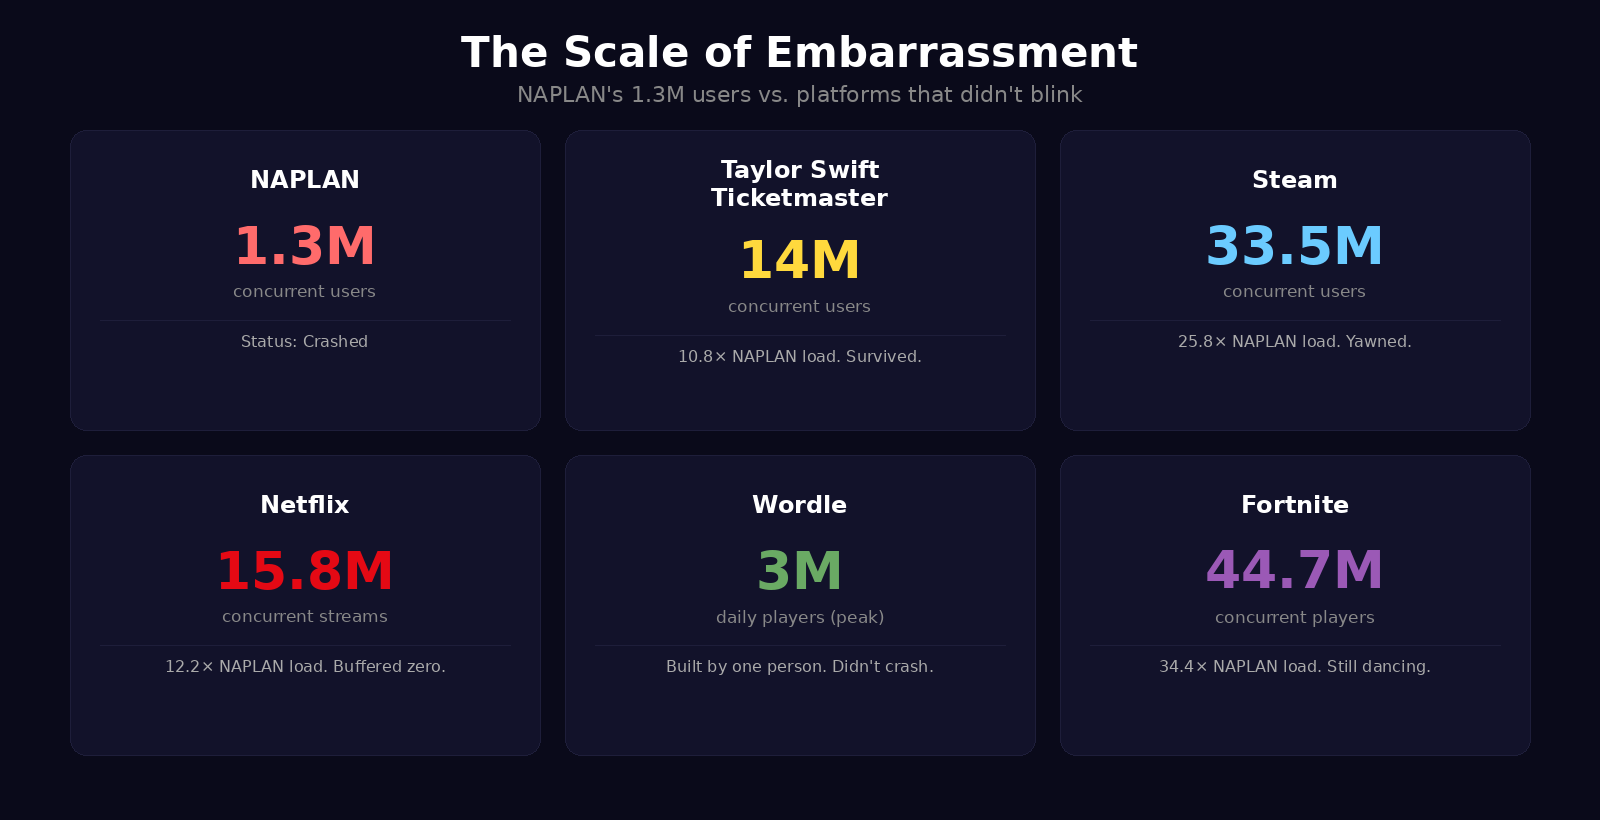
Claude searched for real concurrent user records across streaming, gaming, ticketing, and e-commerce. It researched Wordle's peak usage data. It built a complete single-file HTML report with Chart.js visualisations, original mathematical analyses, and humorous editorial commentary woven through the data. Dark-themed, professionally styled, with multiple chart types, comparison cards, a timeline, and a verdict section that gave the NAPLAN infrastructure a report card of its own.
Prompt 2: Make It Interactive
"This is great. Can we add some interactive graphs and features?"
Fourteen words. That second prompt only works because of the context already established. Claude knew the project, the tone, the data, the audience. It made dozens of creative decisions autonomously, the way a designer would after a good briefing.
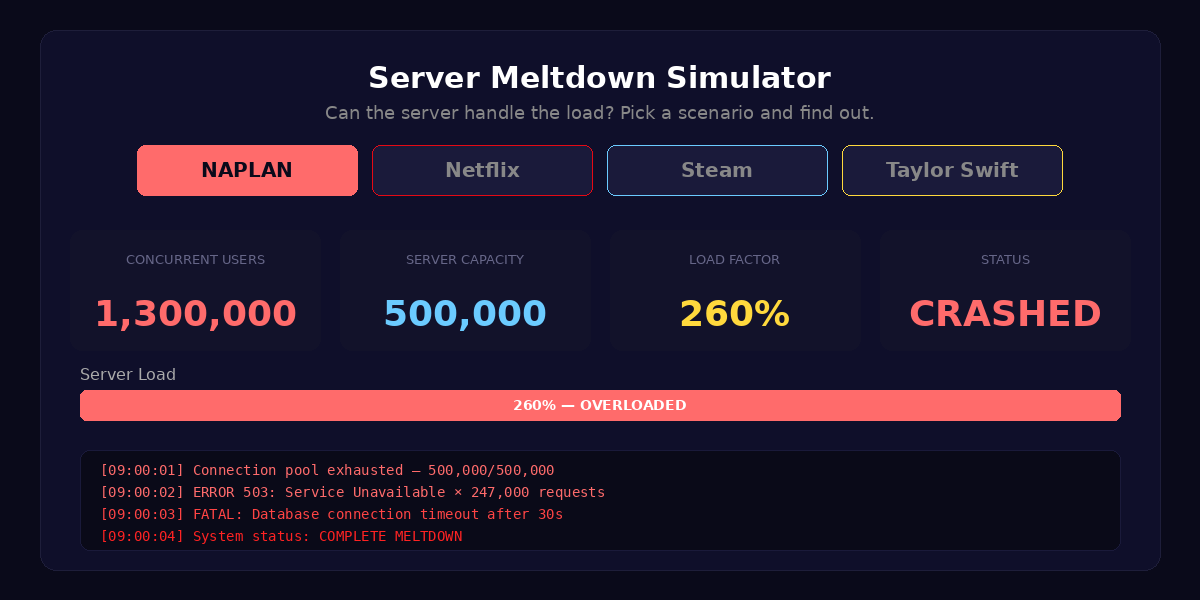
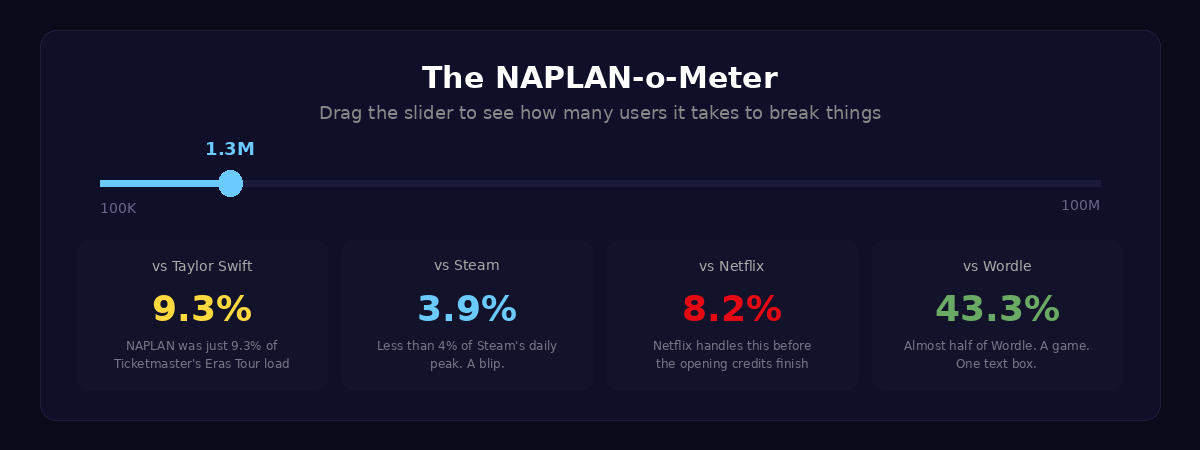
The result: a live Server Meltdown Simulator where you can switch between NAPLAN, Netflix, Steam, and Taylor Swift scenarios and watch the server cope (or not). A NAPLAN-o-Meter slider that lets you drag from 100,000 to 100 million users and see live comparisons against every platform. Animated number counters that tick up on scroll. A clickable roast meter. Matrix-style data rain with falling ERROR and 503 messages behind the mathematics section. Scroll-triggered animations on every section. Seven interactive elements in total, all from a prompt you could fit in a text message.
The Mathematics That Matters
What I care about as a teacher is not the visual polish. It's the maths underneath.
The report calculates bandwidth estimation: how many bytes per student, what the total data transfer looks like, and how that compares to a single Call of Duty update. It works through requests per second, breaking down the login burst versus the sustained autosave load. It runs a genuine cost analysis showing that the cloud infrastructure to handle 1.3 million concurrent users would cost approximately $12 on AWS, then compares that to the estimated $2 million cost of the disruption.
And then there's the Taylor Swift Ratio.
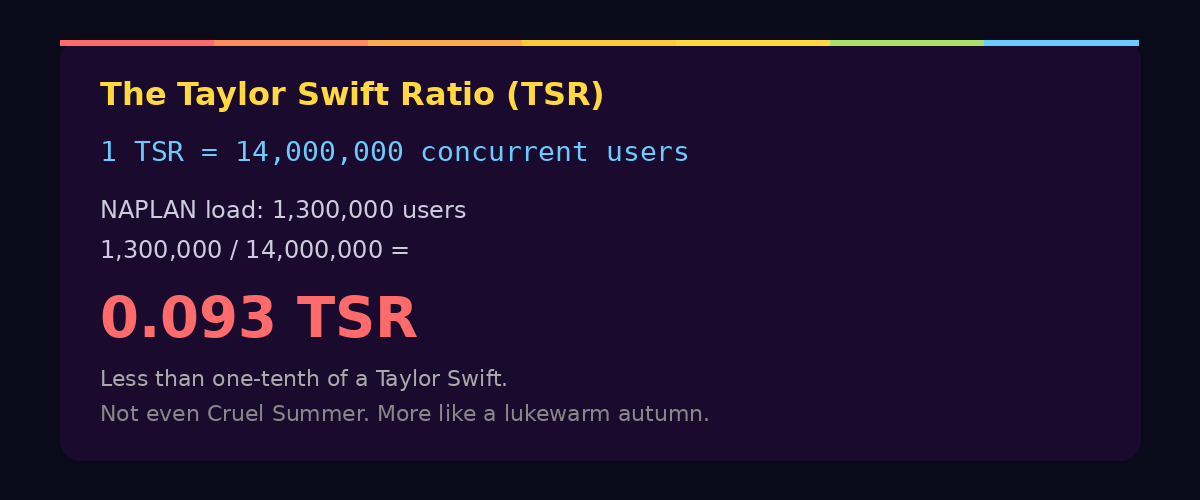
If 1 TSR equals the load of 14 million fans hitting Ticketmaster simultaneously, then NAPLAN crashed at 0.093 TSR. Less than one-tenth of a Taylor Swift. Not even Cruel Summer. More like a lukewarm autumn.
The TSR is a joke, obviously. But it's also a legitimate unit conversion exercise. Students can work with ratios, proportional reasoning, and orders of magnitude while laughing at the absurdity of a national testing platform being outperformed by a website that sells concert tickets. And while the report frames it as comedy, the underlying mathematical reasoning is real: if Ticketmaster can handle 14 million concurrent connections, what exactly went wrong with 1.3 million?
Side note: if our national curriculum body is looking for a consultant on the next version of the mathematics curriculum, I'm keen to advocate for the formal introduction of the Taylor Swift Ratio as a unit of internet scale. I feel strongly that students deserve a measurement system they can relate to. My American friends are still working out whether the metric system is for them. I say skip the debate entirely. Go straight to the TSR.
The Wordle Problem
Perhaps the most devastating comparison in the entire report is the simplest one. Wordle, at its peak in early 2022, handled 3 million daily players. Wordle is one text box. Six guesses. One API call per guess. A game so minimalist it barely qualifies as software.
NAPLAN's writing test needed to handle 1.3 million students. It had years of planning, government funding, and a dedicated assessment infrastructure behind it. Wordle was built by one person as a gift for his partner.
The data speaks for itself.
Why This Is a Learning Adventure
Next week, when my Year 7 class sits down, they'll already have the experience. They watched a national system fail underneath them. Now the job is to help them construct something from that. I'm planning to show them this report and then set them loose. Not to replicate it, but to do what it does: take a real event, find the numbers, and tell the story with computation.
The NAPLAN crash is a gift for a Digital Technology classroom. It's current, it's personal (these are the students who lived through it), and it's built on questions that are genuinely mathematical. How many requests per second? What does bandwidth look like at scale? How do you compare systems that operate at different orders of magnitude? What's the difference between concurrent users and total users?
But the bigger lesson is about what's possible when you pair a question worth asking with a tool that can help you explore it. I didn't write any code. I didn't choose Chart.js. I didn't design the colour palette or decide which platforms to compare. I had a hunch, I articulated it conversationally, and I worked with AI as a thinking partner to turn that hunch into something interactive, mathematical, and genuinely fun.
That's the same workflow I want students to experience. Start with something real. Ask an interesting question. Use the tools to explore it computationally. Make something you want to share.
How to Build Your Own
If you want to try this yourself, here's what I'd suggest. Don't copy my prompts. Find your own event. It could be anything: a sporting upset, a viral moment, a local planning decision, something from the news that morning. The key ingredients are the same.
Your first prompt should communicate three things clearly: the event and its data (give the AI something concrete to anchor on), the tone you want (funny, serious, investigative, playful), and the kind of output you're imagining (visual, interactive, a report, a presentation). You don't need to specify the technology. Let the AI make those decisions. What matters is that you're clear about the intent.
Here's a refined version of my first prompt that you could adapt:
"I want to create a fun, humorous computational report about [EVENT]. The report should compare [KEY METRIC] against other well-known online events that successfully handled equal or greater scale. Make it data-driven: include real numbers, do the actual maths (bandwidth calculations, requests per second, cost analysis), and present everything with charts, diagrams, and visual comparisons. The tone should be insightful but genuinely funny. Build it as a visual, shareable report."
Your second prompt is where context does the work:
"This is great. Now add interactive features. Things the reader can click, drag, and explore. I want them to be able to play with the data, not just read it."
Two prompts. Could probably have been one if I'd had a third coffee and thought about it a bit more. But the point is that brevity works when the intent is clear and the context is established.
What Got Built
The final output is a single self-contained HTML file, around 1,100 lines, requiring no build step, no server, and no dependencies beyond a CDN-hosted Chart.js library. It runs entirely in the browser.
It includes seven interactive elements: a server meltdown simulator with four switchable scenarios, a NAPLAN-o-Meter slider calculator, clickable chart bars with percentage calculations, an animated bar race with hover tooltips, an interactive roast meter, scroll-triggered number counters, and scroll-triggered section reveal animations.
It contains six data-driven sections and four original mathematical analyses: bandwidth estimation, requests per second, the Taylor Swift Ratio, and the economics of embarrassment.
It was built in two prompts over morning coffee by an educator who writes exactly zero lines of JavaScript before breakfast.
The Classroom Question
The question I keep coming back to is not whether students should learn to code traditionally. They should. Understanding what's happening under the surface matters. But the entry point has changed. When a real-world event can become an interactive computational investigation in two prompts, the barrier between "I have a question" and "I built something that explores it" almost disappears.
That's where the energy is. Students don't need to master JavaScript to explore bandwidth mathematics. They don't need to understand Canvas rendering to ask whether the NAPLAN infrastructure could have handled the load. The tools meet them where they are, and the learning happens in the thinking, not the syntax.
The NAPLAN crash was a failure. But as a prompt for a Year 7 class to explore computational thinking, real-world data, and the mathematics of scale? My students didn't read about a system failure. They felt it. And next week, they get to make sense of it.
Turns out the best lesson plans don't come from a curriculum document. They come from experience.
Companion Resources
View the Interactive Report: 1.3 Million Kids vs. The Internet
References
- NAPLAN Online Testing Disruption, March 11, 2026. Widely reported across Australian media.
- Ticketmaster / Taylor Swift Eras Tour demand data, November 2022. Approximately 14 million concurrent users.
- Wordle peak daily players, early 2022. Approximately 3 million daily active users.
- AWS pricing data for cloud infrastructure scaling, 2026.